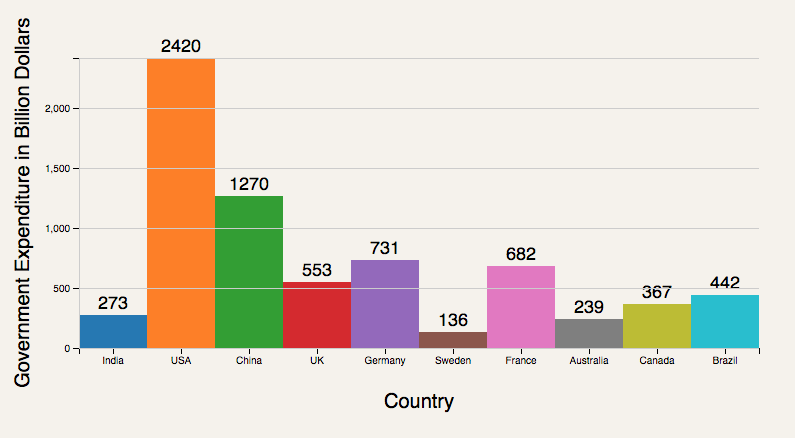
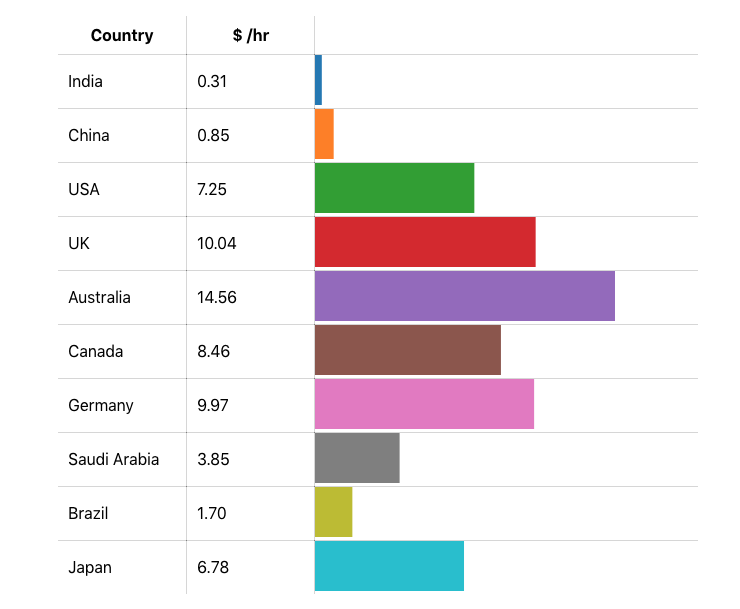
There are several packages to create a Bar chart in React. But consider the scenario where we want to create a highly specialised Bar chart in one of our pages. In this case, my recommendation is to avoid community packages which are usually bloated with too many features or does not have the feature that we need. In this tutorial, I will show how to create a Bar chart in React using SVG components, D3 functions for math and react-move for animations.…
Tag: D3
For doing charts, I use D3 quite a lot. D3 is a low level library which allows to create SVG elements with ease. It has built-in math functions. The support for animations is quite intuitive. For using D3 with React, I rely on react-faux-dom, a library that provides another DOM implementation. For visualizations without interactivity, react-faux-dom does a good job. However, when we want to add interactivity to our graphs, react-faux-dom falls short.…

Bar chart is one of the common chart types widely used in data visualisation. Most of you know about D3 and how D3 is an integral part of your toolset in data visualisation. However, D3 is not for everybody. It provides a low level API to create a SVG. Yes, all charts made in D3 are SVG elements. In this post, we will use D3 in our React app to create just another bar chart.…
